32 - Boiling
4. Regions in Pool Boiling Curve
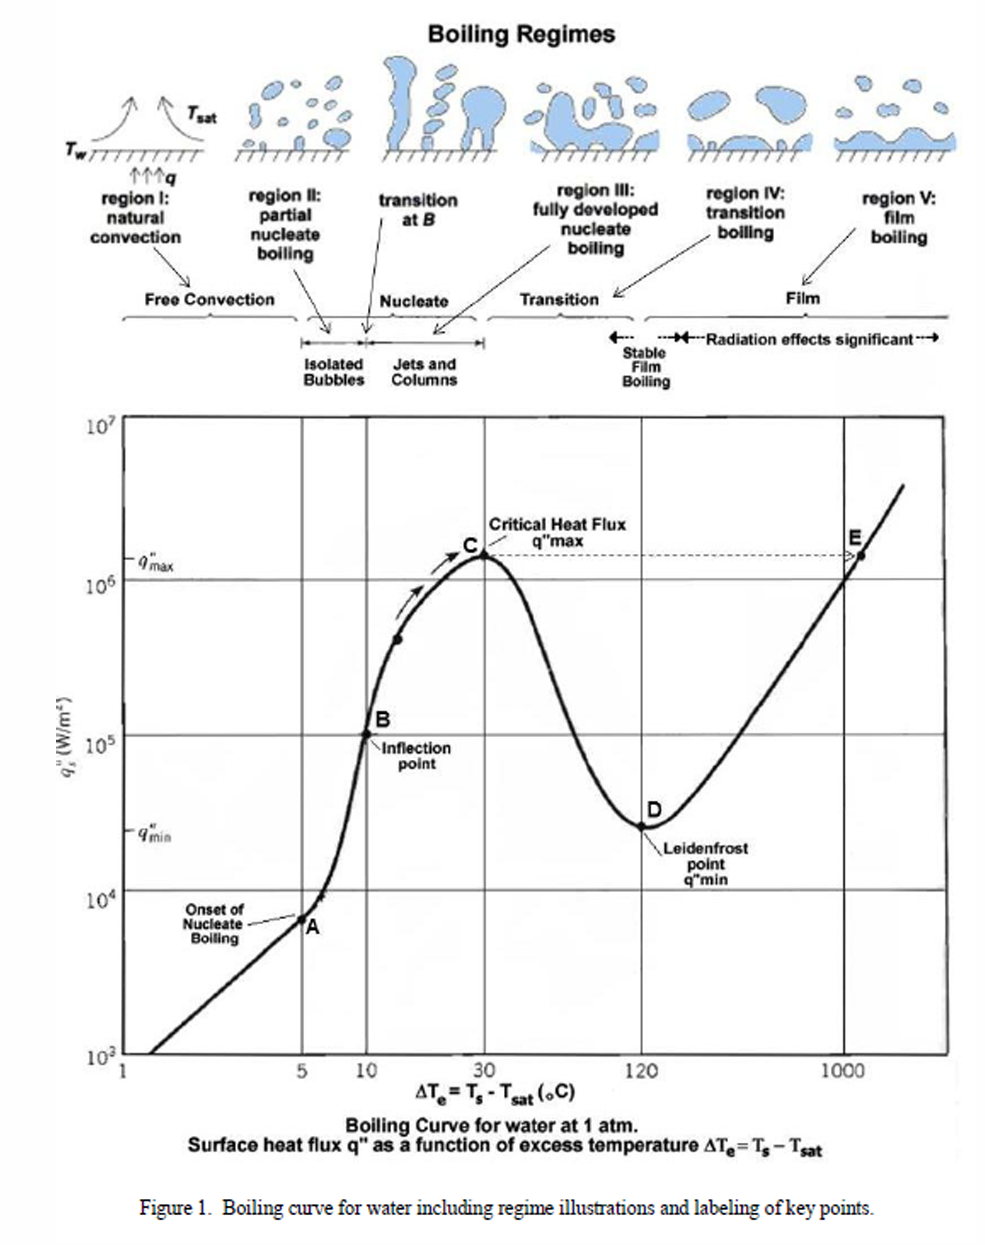
Farber and Scorah conducted their experiments by heating the water at various pressures with a heated cylindrical wire submerged horizontally under the water level. From the results, they divided the boiling curve into 6 regions based on the observable patterns of vapor production.
Region I: \(\Delta T\) is so small that the vapor is produced by the evaporation of the liquid into gas nuclei on the exposed surface of the liquid.
Region II: \(\Delta T\) is large enough that additional small bubbles are produced along the heating surface but later condense in the region above the superheated liquid.
Region III: \(\Delta T\) is enough to sustain “nucleate boiling”, with the creation of the bubbles such that they depart and rise through the liquid regardless of the condensation rate.
Region IV: an unstable film of vapor was formed over the heating surface, and oscillates due to the variable presence of the film. In this region, the heat transfer rate decreases due to the increased presence of the vapor film.
Region V: the film becomes stable and the heat transfer rate reaches a minimum point.
Region VI: Here, \(\Delta T\) is very large, and “film boiling” is stable such that the radiation through the film becomes significant and thus increases the heat transfer rate with the increasing \(\Delta T\).