Instant Notes: 2. PVT Behavior
Completion requirements
2.1 Thermodynamic Diagrams
\(PT\) Diagram
Fig.(4) shows the \(PT\) diagram (i.e., pressure - temperature relationship) of a pure substance. This diagram is often called the phase diagram since all three phases are separated from each other by three lines. These three lines meet at the triple point, where all three phases coexist in equilibrium. The vaporization line ends at the critical point because no distinction can be made between liquid and vapor phases above the critical point.
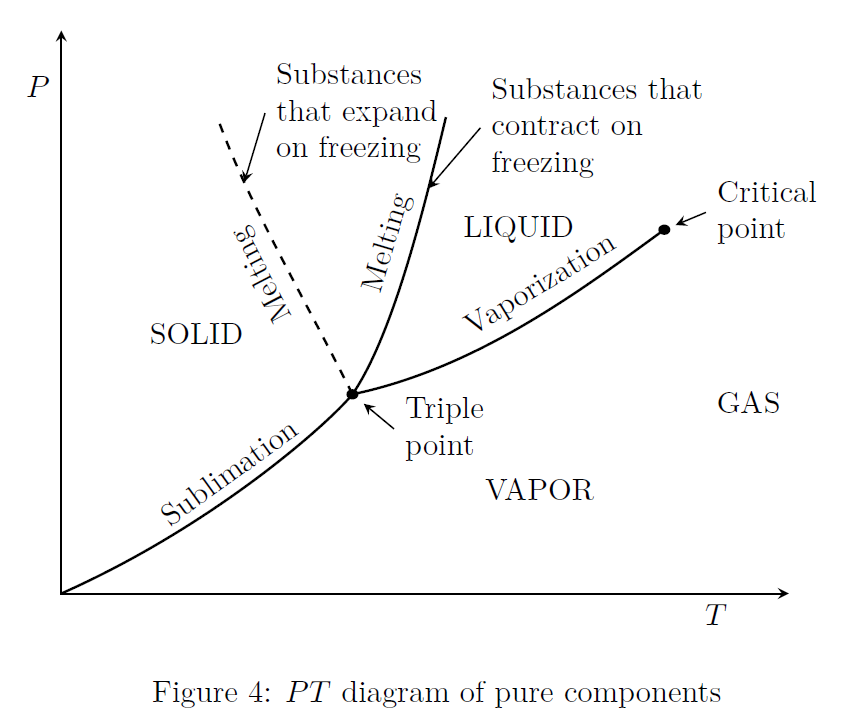
In Fig.(4), the dashed line depicts the melting process of substances (only a few) which expand upon freezing, for example water. However, most simple substances, show the behavior of contraction on freezing.