Instant Notes: 2. Interpretation of Batch Reactor Data
Differential Method of Analysis of Data
Steps involved:
-
Plot the experimentally obtained concentration versus time data.
-
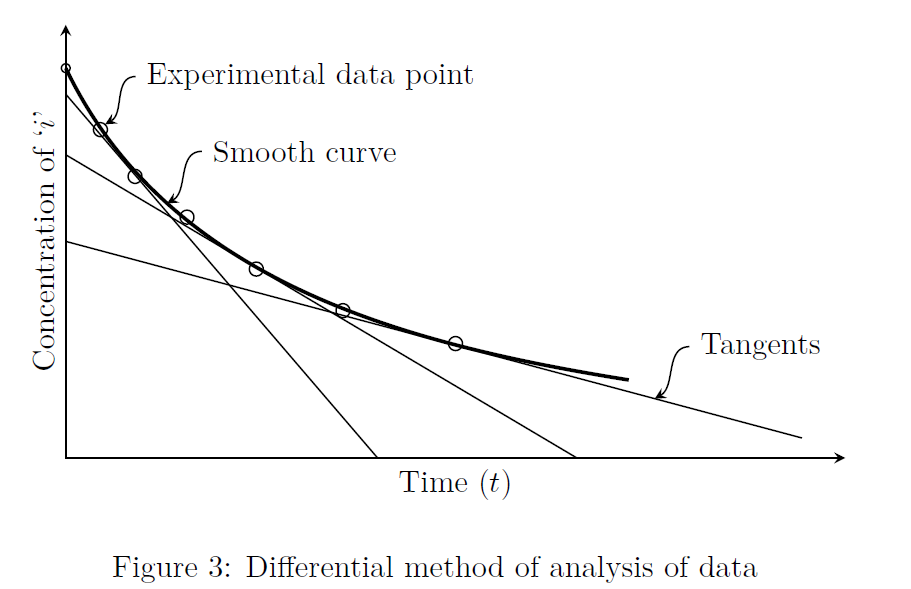
Draw a smooth curve to understand the overall trend of the data. This smooth curve need not pass through all the data points.
-
Draw the tangents to the curve at different values of concentration and calculate the slopes (refer to Fig.3). These slopes represent the values of the rates of reaction at these respective concentrations (\(-dC_A/dt=-r_A\)). Now we have, rate (i.e., \(-r_A\)) data as a function of \(C_A\).
-
-
Guess any rate law (i.e., an equation for the rate of reaction) and plot a graph of \((-r_A)\) versus guessed \(f(C_A)\) which should yield a straight line, or
-
Test for an \(n^{\text{th}}\)-order power-law model for the rate of reaction: \(-r_A=kC_A^n\) (take logarithms on both sides to draw the graph).
-