Instant Notes: 5. Stability Analysis
-
Bode Diagrams
-
Bode diagrams constitute a convenient way to represent the frequency response characteristics of a system. Bode plot of typical systems are shown in Fig.(18).

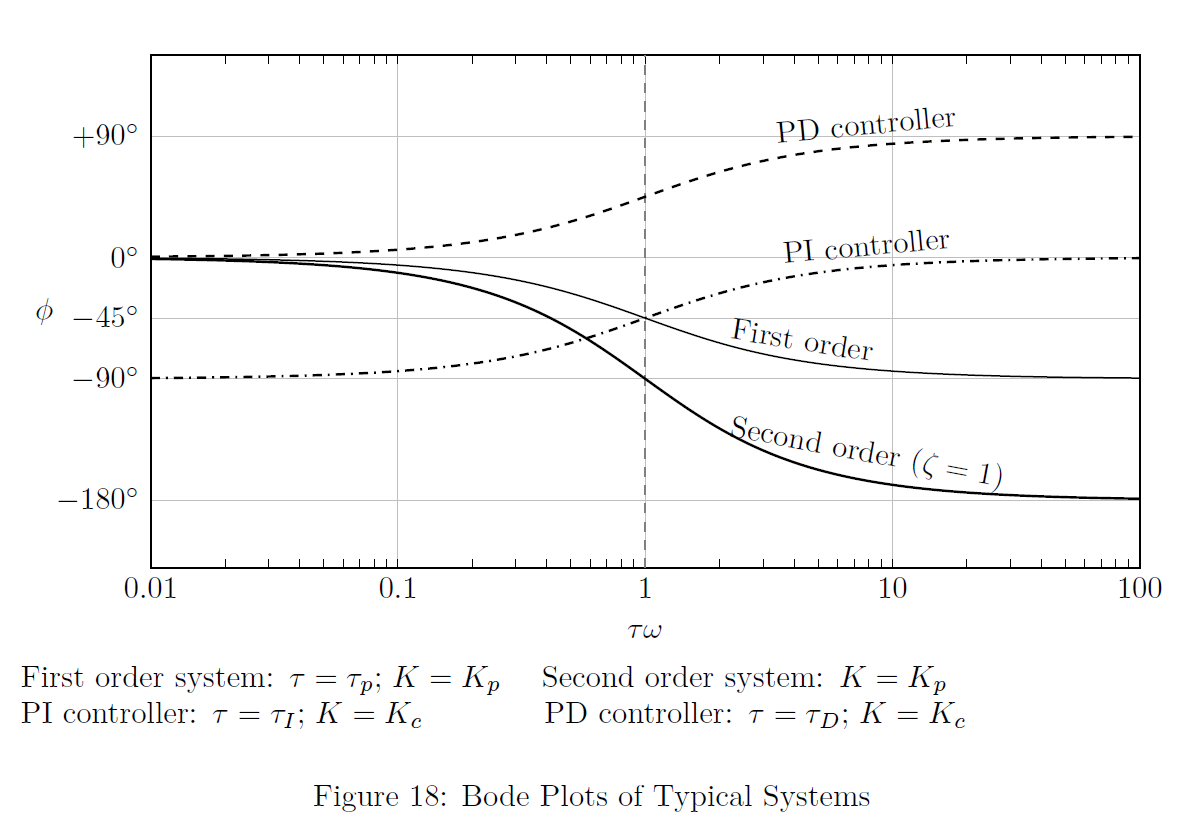
It is easy to sketch Bode plots because they have linear asymptotes. This is useful in order to get a quick estimate of the behavior of a system.
-
Bode diagrams consist of a pair of plots showing: (i) the variation of amplitude ratio with frequency [\(\log\)(AR) vs. \(\log(\omega)\)], and (ii) the variation of phase shift with frequency [ \(\phi\) vs. \(\log(\omega)\)].
-
Amplitude ratio of Bode diagrams are easily constructed with the low-frequency asymptote (\(\omega\rightarrow 0\)) and high-frequency asymptote (\(\omega\rightarrow \infty\)) values.
-